
The Anatomy of Harmful AI: What 1,400 Incidents Reveal

Paligo’s analysis of more than 1,400 harmful AI incidents shows which systems, themes, platforms and groups are most likely to be associated.
As AI platforms become more widely used, the potential scale and costs of them malfunctioning also grows. But are certain platforms more associated with failures and harmful incidents? And are particular groups more affected?
For this research, we analyzed more than 1,400 incidents recorded on the AI Incident Database, and categorized them by the most common sectors, platforms and affected groups that appear in the incidents. These include a mixture of incidents.
Key findings:
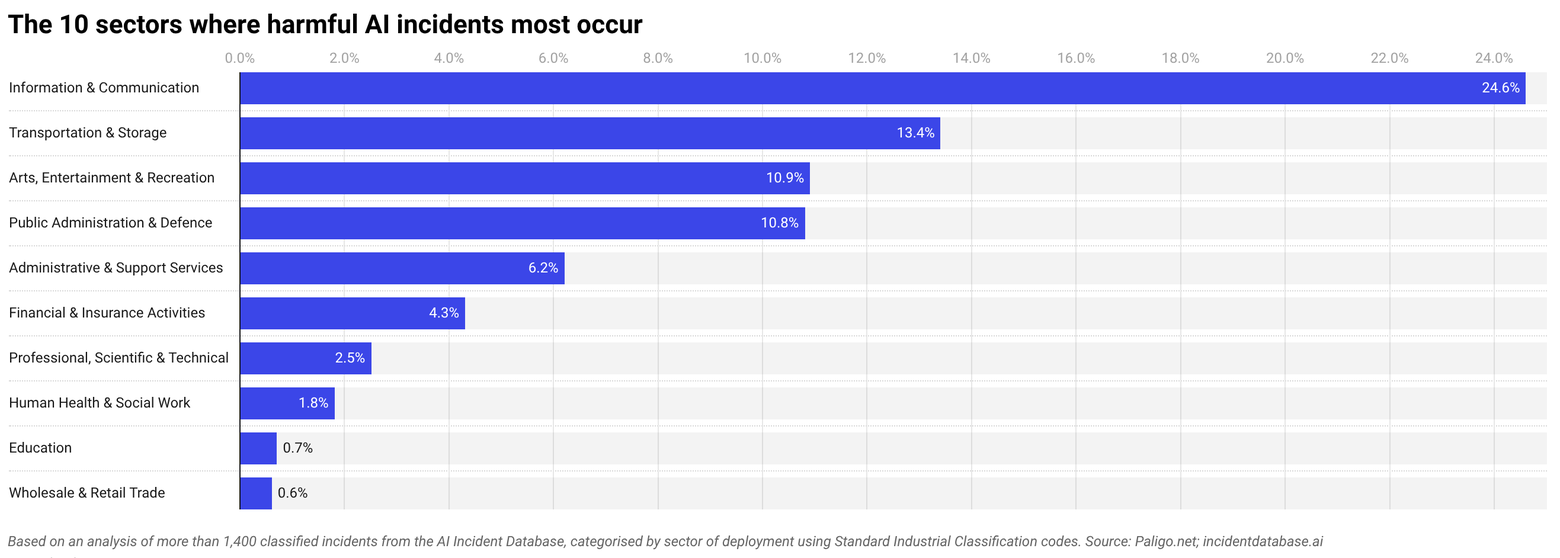
- Information and communications is the dominant sector for harmful AI incidents (25%), with the four most common harm types being physical safety (20%), financial loss (16%), psychological harm (14%) and civil liberties violations (13%), which cut across all sectors.
- More than a quarter of all harmful AI incidents affect ordinary members of the public with no specific group targeted. However, when AI does harm one group more than another, race or ethnicity is the most likely differentiator for who gets targeted.
- Among named organizations, OpenAI (5%), Google (4%) and Facebook (4%) appear most frequently in documented harmful incidents, largely reflecting the scale of their deployment in AI.
- Nearly half of all documented harmful AI incidents (49%) involve software-only systems, including cases where AI-generated content errors in publishing and documentation caused direct financial and legal consequences.
- Social media platforms collectively appear in 19% of incidents where a system was implicated, with Facebook the most frequently implicated platform (4%) and ChatGPT the most frequently named LLM (4%).
IT, Transport, and Arts and Entertainment are the sectors most impacted by harmful AI incidents
Information and communications is the most dominant sector where harmful AI incidents take place, which spans social media platforms, search, advertising and content systems. One in five incidents recorded were within IT, which have included Facebook’s On This Day feature surfacing painful memories including deaths and breakups to users uninvited and Amazon’s recommendation algorithm found to be boosting its own products over more relevant results.
While many platforms and IT systems cause Information and Communications to rank as the most common sector for harmful AI incidents, many of these issues extend into money, health and civil freedom. Across all sectors, the four most common types of harm reported involved physical safety (20% of incidents), financial loss (16%), psychological harm (14%) and civil liberty violations (13%).
Other common sectors with heavy reporting of harmful AI incidents are Transportation and Storage (13% of incidents), and Arts, Entertainment and Recreation (11%) and Public Administration and Defense (11%).
The general public are targeted most often by harmful AI
More than one in four (26%) reported incidents of AI harm are non-discriminatorily targeting the general public, with incidents including Google’s AI Overviews confidently providing incorrect and potentially harmful medical and geographic information to millions of users.
At least 13% of harmful incidents clearly target or put users of social media platforms at risk. One notable example in 2023 involved reports of Facebook’s ad delivery algorithm showing job advertisements disproportionately to men, regardless of the advertiser’s stated targeting preferences.
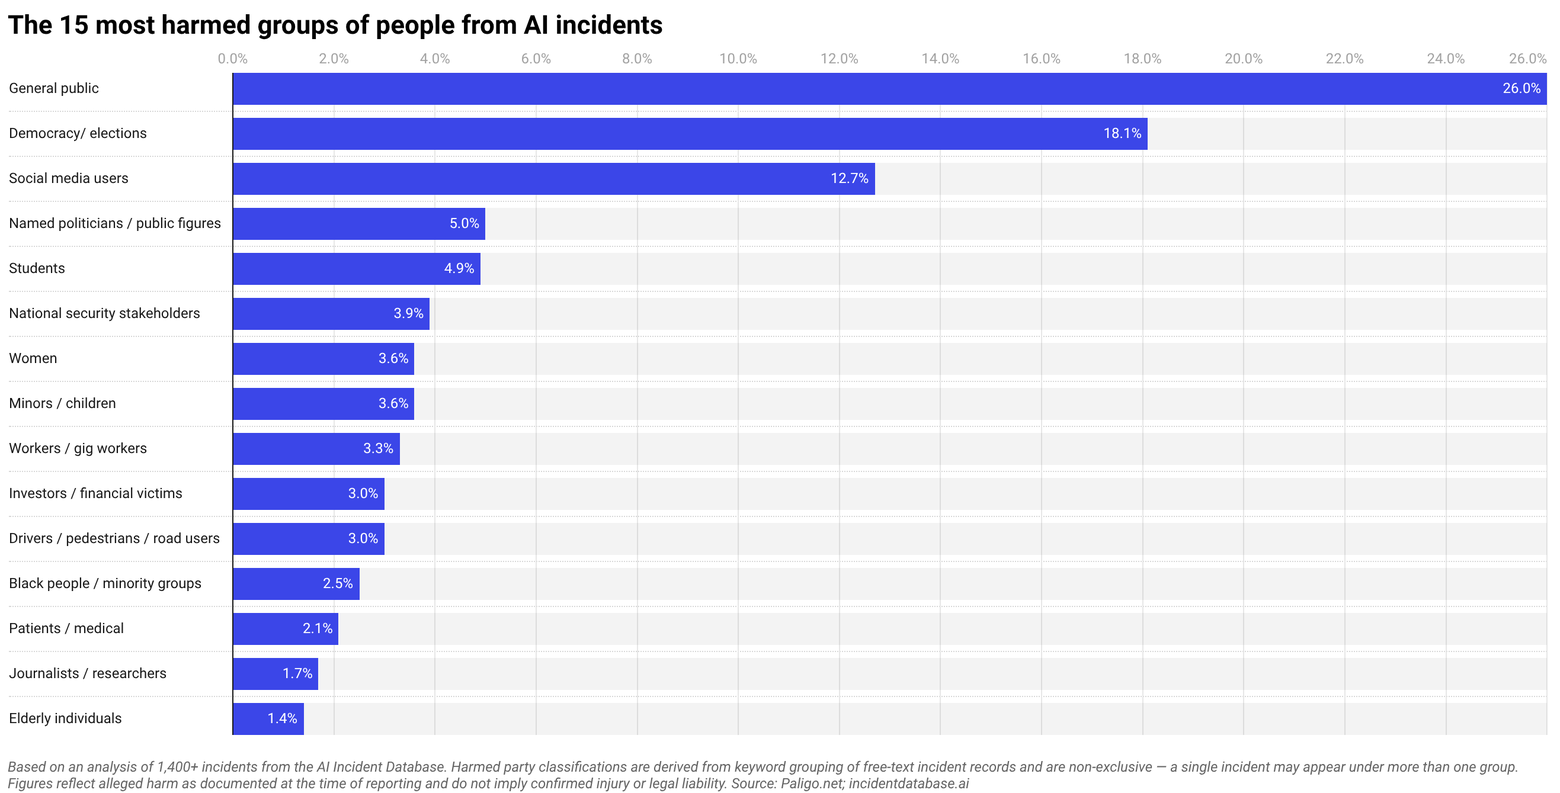
Many AI incidents reported carry implications for financial risk or losses among the general public, including a 2024 scam that exposed the use of AI-generated deepfake videos of billionaire Andrew Forrest to promote a fraudulent cryptocurrency investment platform on social media.
Many incidents of AI harm affect more than one group or demographic. Among incidents where a particular group is more heavily impacted, race is the most common differentiating factor, appearing in 16% of all documented incidents. Examples include Detroit Police wrongfully arresting a Black man based on a faulty facial recognition match, and a long-used kidney function testing algorithm found to systematically underestimate health risk in Black patients.
OpenAI, Google and Facebook are most frequently identified as deployers in reported harmful AI incidents
Among named organisations most frequently identified as deployers in documented harm incidents. Deployers are the party putting AI into use. OpenAI (5%), Google (4%), Facebook (4%) and Tesla (3%) appear most often. This largely reflects the scale at which their systems are deployed rather than confirmed liability for harm, and in each case the organisation was named in incident records rather than found legally responsible.
Tesla’s incidents are distinct from the others, rather than platform or content failures, its appearances are concentrated in autonomous vehicle incidents where physical injury is the primary documented consequence.
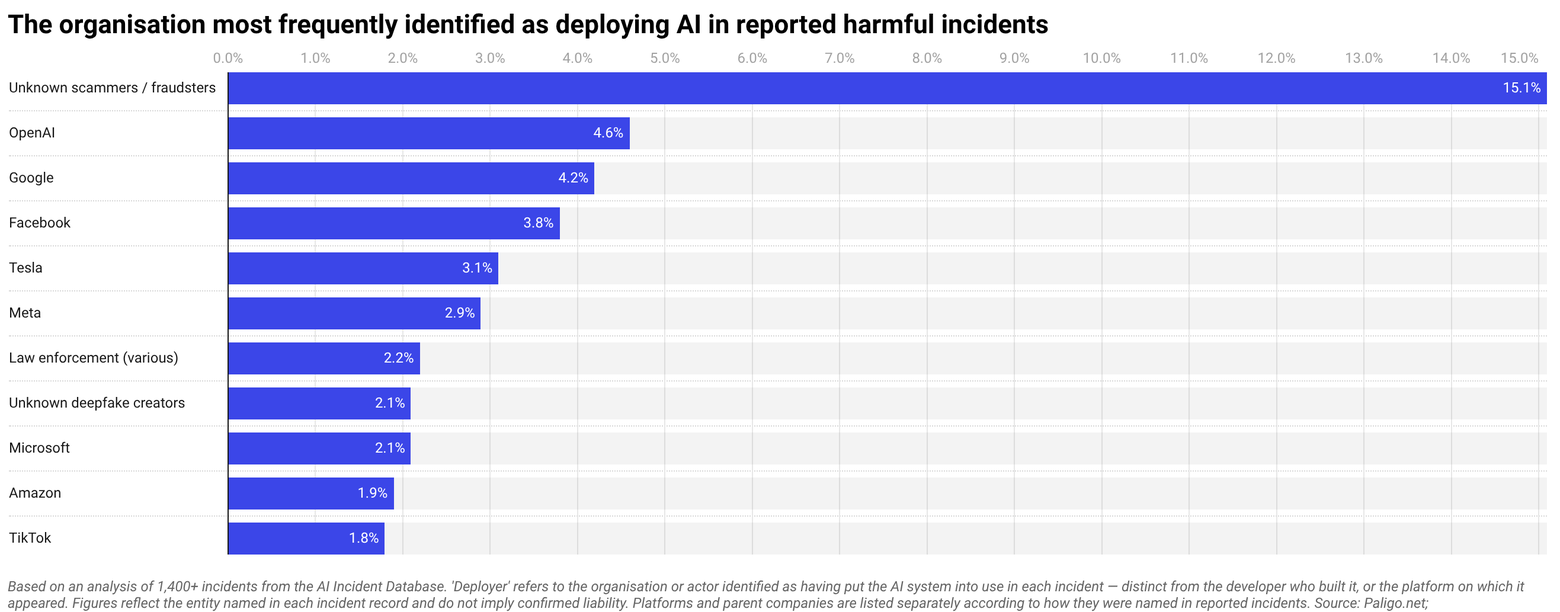
A further 15% of incidents could not be attributed to any named organisation, with cases predominantly involving deepfake voice cloning and investment fraud where the party using the AI remained unidentified.
Software accounts for almost twice as many harmful incidents as all physical systems combined
The most prevalent form of harmful AI requires no hardware or physical object, with nearly half of all documented incidents (49%) involving software-only systems.
For companies managing structured content and technical documentation at scale, this presents operational risks. The AI embedded in the systems used to create content carries the same potential for harm as any other software..
One famous example of this from recent years was a $439,000 Deloitte report submitted to the Australian government found to contain fabricated academic citations attributed to AI use.
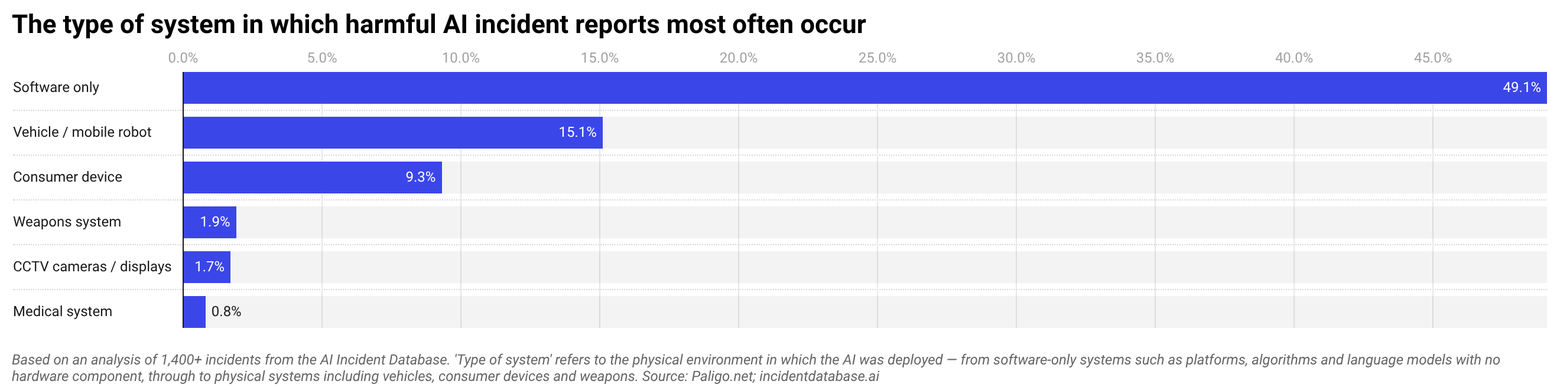
A further 15% of harmful incidents involve vehicles or mobile robots, which is the category most associated with physical injury and death. These include Tesla Autopilot fatalities and Waymo collisions.
Consumer devices account for 9% of incidents, with previous cases including Amazon’s Alexa recommending a dangerous electrical challenge to a ten-year-old girl and Apple’s Face ID failing to distinguish between identical twins.
Which platforms are implicated in harmful AI reports most often?
Among named systems where platforms were directly implicated in incidents, social media platforms collectively appear in 19% of incidents, which is more than any other system category.
Facebook is the most frequently implicated individual platform at 4% of cases, with incidents including its AI chatbots entering online grief and mental health support communities uninvited and responding as though human.
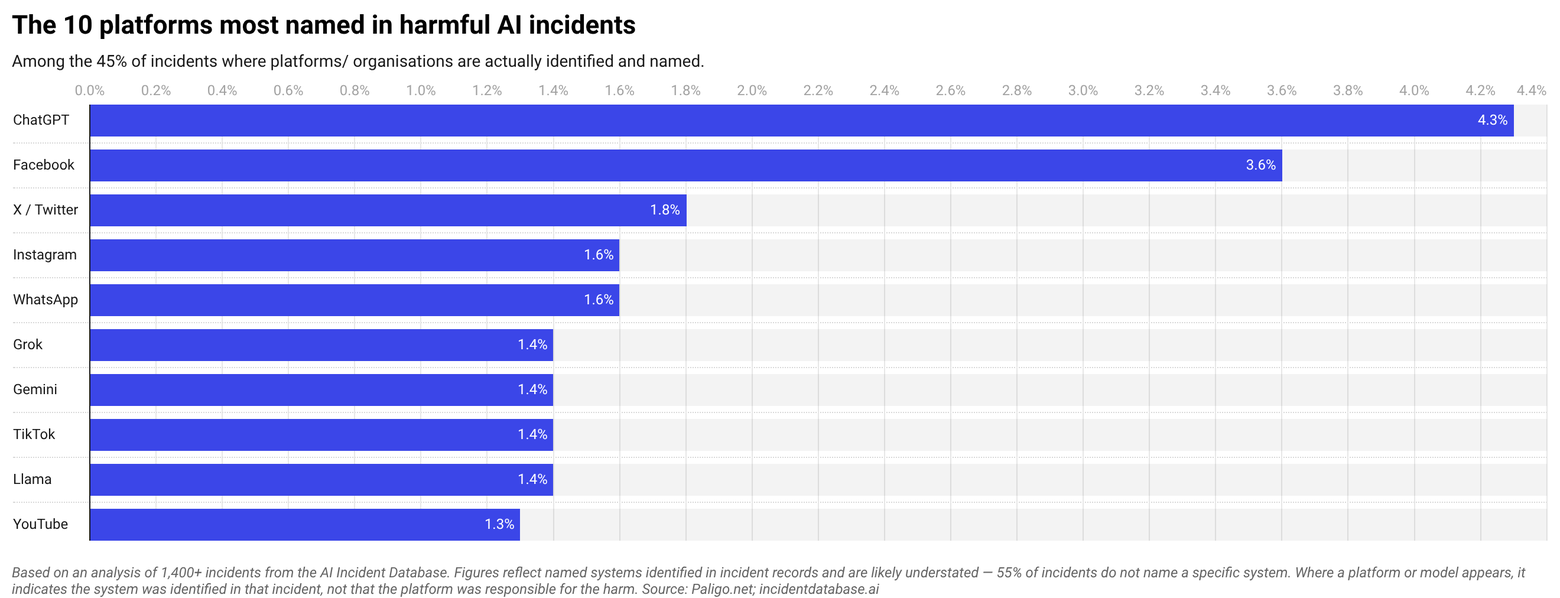
TikTok appears in 1.4% of incidents, including one where a lawsuit filed by seven French families alleging its recommendation algorithm systematically exposed minors to content promoting self-harm, eating disorders and suicide.
ChatGPT is the most frequently named LLM at 4.3% of all incidents. One case involved a child protection worker in Victoria, Australia that used it to draft a court report that introduced inaccuracies and downplayed risks in a live child safeguarding case.
Among other LLM incidents, Air Canada’s customer service chatbot appears in the analysis after providing a passenger with incorrect bereavement fare information. A Canadian tribunal ordered the airline to pay damages, making it one of the first cases of a company being held legally liable for its chatbot’s output.
5 ways to ensure your content accurately feeds into an AI system
- Structure your content before it reaches AI
AI systems process what they’re given, so if your content is inconsistently formatted, poorly labeled or buried in unstructured documents, the output will reflect that. Structured authoring with consistent headings, metadata and topic-based organization gives AI systems the clearest possible input to work from. - Use single sourcing to eliminate version conflicts
One of the most common causes of AI-generated errors is contradictory source material. If the same information exists in multiple versions across different documents, an AI system has no reliable way to determine which is current. Single sourcing, which means maintaining one authoritative version of each content component, will remove that ambiguity at the point of ingestion. - Maintain a clear taxonomy and metadata schema
AI systems rely on context to interpret content correctly. A well-maintained taxonomy tells the system what a piece of content is, who it is for, and where it sits in relation to other content. Without it, the system is making inferences that may be wrong. In YMYL contexts, wrong inferences carry real consequences that can lead to the types of harmful incidents that our analysis explored in this article.. - Review and validate AI outputs against source content
AI-generated content should always be traced back to the source material it drew from. If an output cannot be verified against a specific content component, it should be treated as unreliable. Building a review step that explicitly checks AI outputs against structured source content is the most direct safeguard against the kind of hallucination and fabrication documented in the incident database. - Keep content current and retire outdated material
Unsurprisingly, AI systems trained or prompted on outdated content will produce outdated outputs! In areas like medical guidance, legal information or financial advice, outdated outputs cause documented harm. A content lifecycle policy that retires superseded material is an essential risk management measure to avoid future harms occurring.
Methodology
Researchers at Paligo analyzed 1,406 unique incidents recorded in the AI Incident Database (correct as of March 2026). Incidents were categorized and ranked by the most common sector, harm type, harmed party, deploying organization and associated system using pre-classified taxonomies from the AI Incident Database, and supplemented by a keyword analysis of incident records where taxonomy annotations were absent.
All figures represent the percentage of incidents in which a given category, entity or system was identified — not the percentage of total harm caused, and not a measure of confirmed legal liability. Where organisations or platforms are named, this reflects how they were recorded in incident reports at the time of documentation rather than any finding of responsibility. Counts across some categories are non-exclusive, meaning a single incident may appear under more than one classification.
Stay ahead in structured content
Get the Paligo Pulse once a month.


