Balancing Visuals and Text in Documentation Writing

Technical writers are experts at determining topic organization, tone, flow, and verbiage when it comes to documentation writing.
However, one component that is often overlooked or shied away from is balancing visuals and text in documentation. This article is intended to provide a deeper understanding into how technical writers – not graphic designers – can use visuals to enhance their work and help them to develop highly effective documentation writing by addressing the following questions:
- How should you determine when visuals – graphics, illustrations, drawings, plots, or screenshots – are necessary?
- What considerations should you think about when editing visuals and adding labels?
- How do you mitigate the risk of misinterpretation when connecting text to visuals?
When are Visuals Necessary in Documentation Writing?
Visuals can help readers quickly understand complex concepts and processes, and form part of your documentation strategy. They allow readers to visualize relationships and events, whereas the same information in text can be more difficult to grasp. They also give readers’ eyes a break when reading text, and can help invigorate interest in lengthy content that can, at first look, feel quite daunting.
For example, when creating procedural documentation writing, you often spend time thinking of the most efficient and clear way to describe an action. Once that is written, the user must then read the text and fully visualize what they need to do to successfully follow that step. Certain procedures may be quite straightforward and a corresponding image may not significantly contribute to understanding or provide any assistance in achieving clarity. However, more complex steps may benefit from a graphic to help enhance the reader’s understanding.
Complex steps that involve multiple actions or visual identification of any parts or components can be clarified by a labeled graphic. For example, an image of how to install “part A” to secure “part B” to “part C” will show the reader how the parts need to be assembled in a secure fashion with minimal room for misinterpretation. Alternatively, if the reader needs to identify “vial 3” from “vial 4,” a picture showing the differences between the vials will allow the reader to quickly identify which vial needs to be used.
Without an example, it can be challenging to imagine these more complex actions. Therefore, the image serves as a guide, directing the reader on what to look for or how to perform the task. In turn, this allows the reader to quickly understand and complete the procedure in shorter time frames. This naturally leads to happier readers.
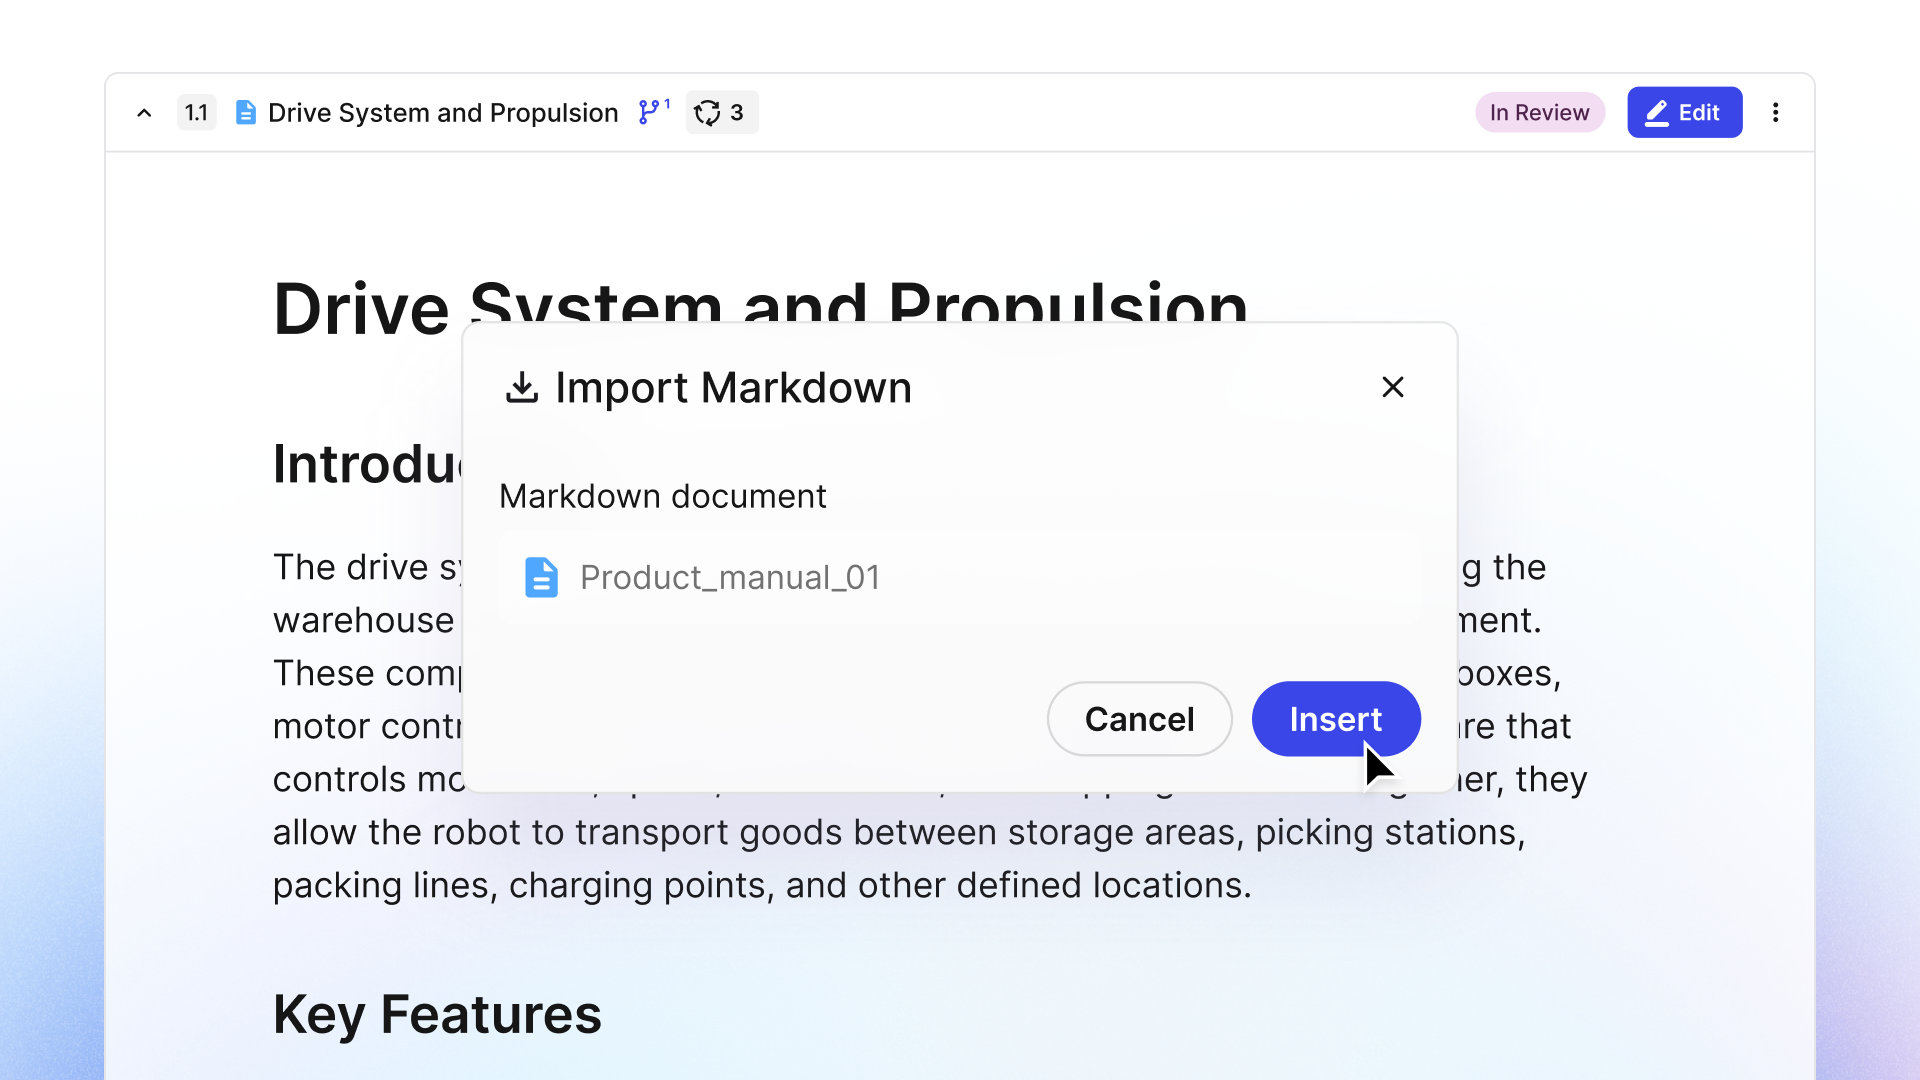
Screenshots can also provide readers with easy direction when text may take too long to describe visual content. For example, a screenshot showing where on the website a user can change account settings can often be accompanied just by simple, concise text: “click on the dropdown menu circled in red in the screenshot below and select account settings.” This is far more efficient documentation writing than describing how to locate the dropdown menu on the webpage only in text.
Plots and other graphical representations of data are also particularly important and useful in the proper context. Frequently, when creating report documentation writing about data or results, it may be beneficial to include corresponding plots to help readers easily identify patterns and noteworthy findings. No board member wants to spend hours reading data points when the information could have been summarized in graphical form.

When to Use Visuals in Documentation Writing – A Summary
- Images visualizing how to complete complex steps that involve multiple actions or that may otherwise have room for misinterpretation
- Pictures for easy and fast visual identification of any parts or components
- Screenshots can provide readers with easy direction when text may take too long to describe visual content
- Report documentation writing that discusses data or results could include associated plots (as applicable) to allow the reader to quickly and easily recognize trends and interesting results
Considerations When Editing Visuals and Text in Technical Documentation Writing
Now that we have a clear idea of when to use visuals, it is time to think about what considerations need to be made when editing them. Often a plot, picture, or other image is given to technical writers with little context and no labelling. It is our job as documentation writers to understand the meaning of the visual and how to use it for maximum effectiveness (including clarity and concision) in the documentation.
Labels
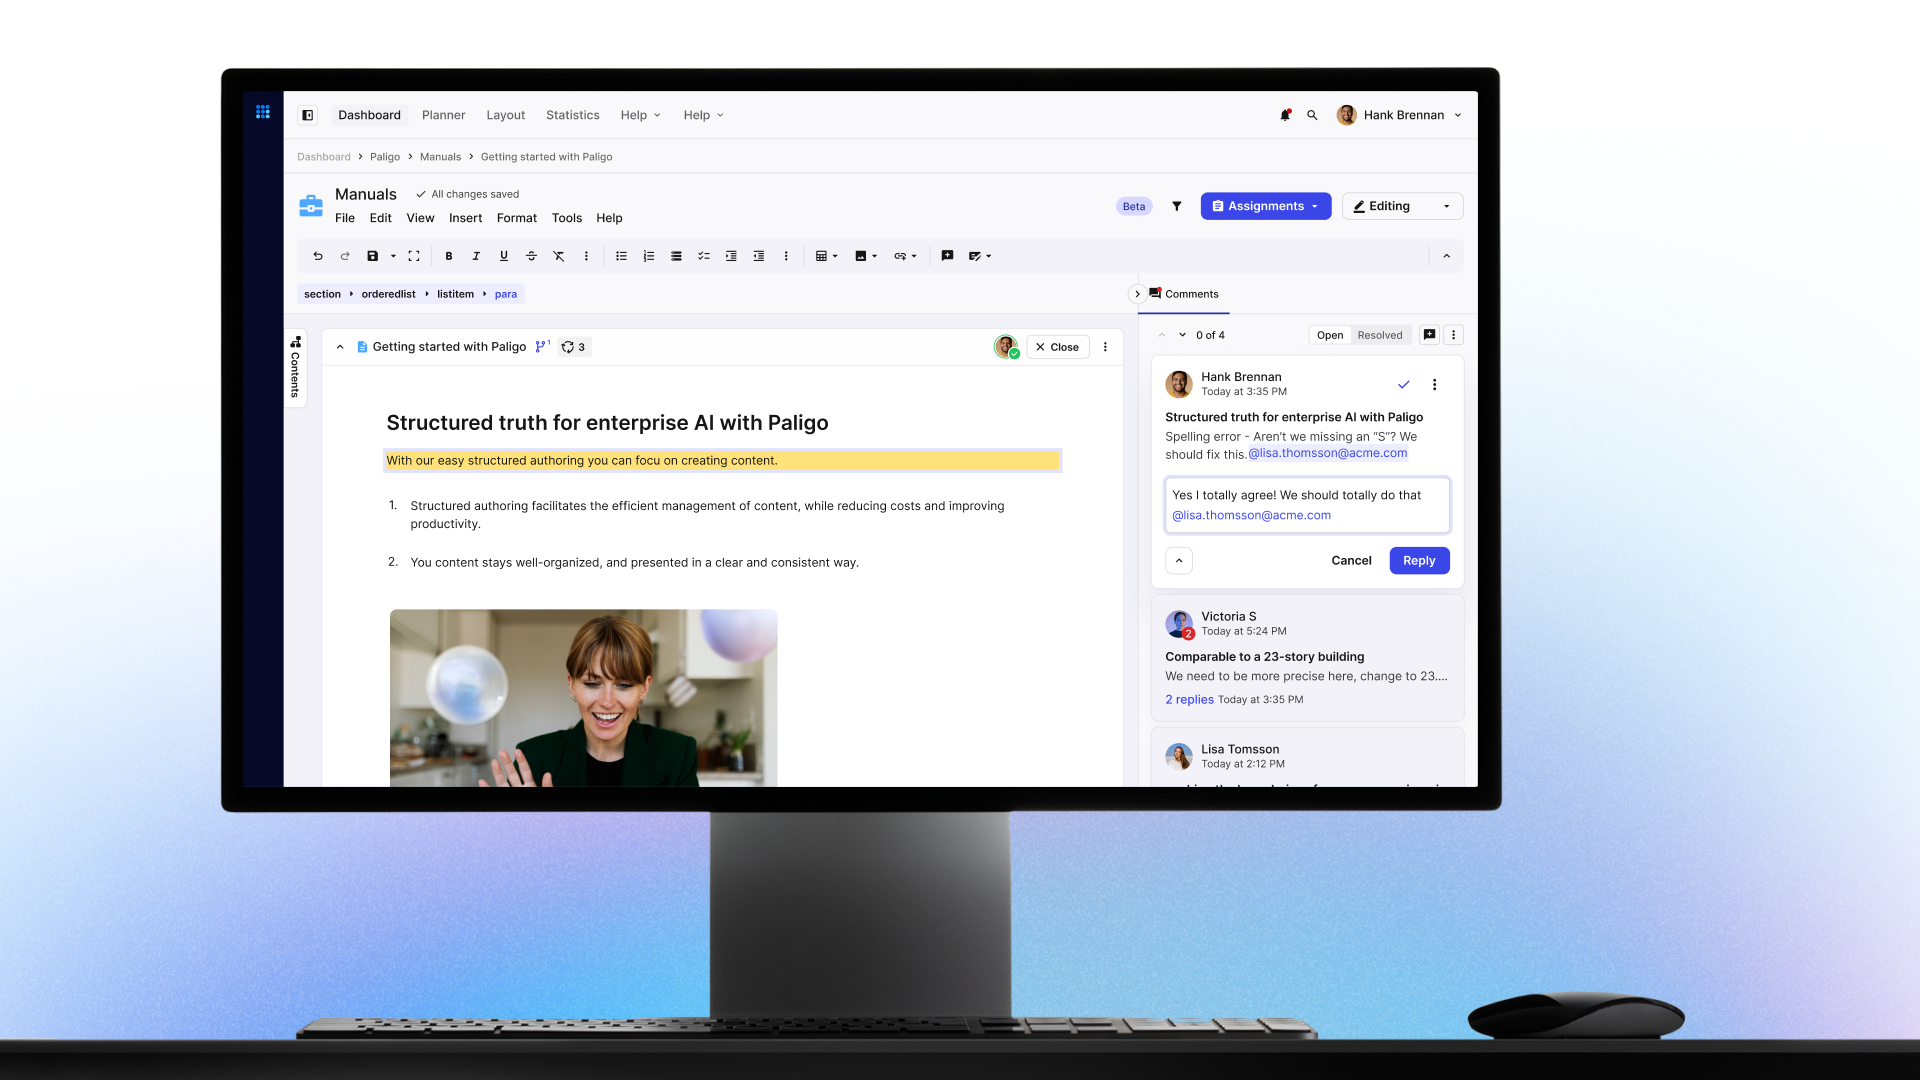
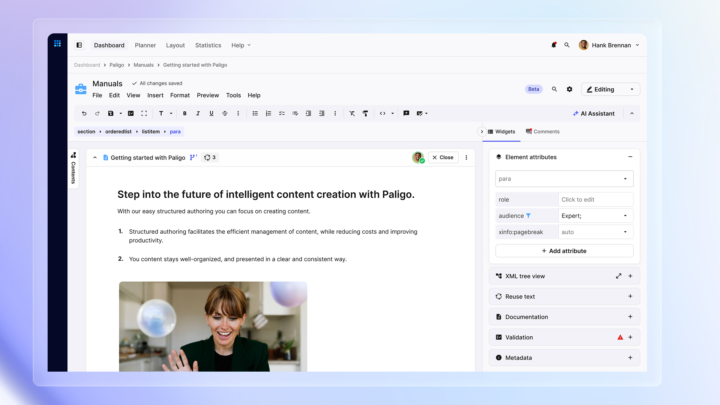
Labels should detail exactly what components the reader needs to pay attention to within the visual. This is especially important in data-driven reports and procedures – particularly for procedures with safety concerns. No reader wants to spend time interpreting an image that was intended to help their understanding. Instead, show them exactly what you discuss and reference in your documentation writing with clear labels, arrows, circles, or any other applicable labeling.
Of course, it can be easy to over-label. Only label exactly what the reader must know to understand the text, and nothing more. Everything else is excess and should be cut for clarity and concision.


The image above shows one specific button highlighted by the green circle and clearly marked with an arrow. Meanwhile, the other image labels four different buttons that have nothing to do with one another – this is an example of an image being used for too many purposes. The first image will make it much simpler for the reader to immediately recognize and comprehend the intended use of that button, as described in the accompanying text.
Keeping Accessibility in Mind
Another important consideration when incorporating visuals into your documentation writing is accessibility. This especially applies to those in your audience who have color-blindness or other visual impairments. Seeing the difference between a green positive trend and a red negative trend can be very difficult for those who are red-green colorblind. Likewise, using tiny arrows or text in your labels can be challenging for those with other visual impairments.
Luckily, there are many online resources (such as Learn UI and Colorsafe) that can help you choose colors that are more accessible. Additionally, it is best practice to include alt-text in visuals for online documentation. Alt text describes the image to readers who have visual impairments. If possible, do user testing on your content. Inviting people with visual impairments to use your content can provide valuable insights.
Top accessibility tips:
- Avoid using only red and green in your graphics. This is one of the most common types of colorblindness.
- Avoid small text anywhere in your documentation. You want to help your readers, not harm their vision or frustrate them!
- Always include alt text with every visual in your content. This will allow those with visual impairments to understand your visual, despite their impairment.
Giving and Receiving Feedback on your Documentation Writing
Just as it is important to get comprehensive feedback on your text, it is also important to get feedback on the graphics used in your documentation writing. After all, the text and the graphics should be working together for easy comprehension. If your SMEs and other reviewers do not mention the graphics, ask about them specifically. “What did you think of this plot?” Or “did you understand how rotating the shaft during cam installation works? Did Figure 2 help?” These are perfectly valid questions to make sure your graphics fully support your audience. Having someone with a new viewpoint review the written documentation and provide feedback on their understanding can reveal any issues with clarity.

Mitigating the Risk of Misinterpretation
Technical writers are pros at mitigating risk of misinterpretation. It is our job to ensure the content provided has one clear meaning with minimal ambiguity, and visuals can certainly aid this intention. But what specifically should tech writers be on the lookout for?
Refer to the Visual Within the Text
When an image, plot, or other visual is used in your documentation writing, it is generally best practice to use the text to ground it. Visuals – be they image, plot, or other graphic – floating around your document without any explanation or textual reference can be confusing. This is especially true for procedural documentation. Including a graphic without an explanation may cause your reader to be uncertain if they have completed all of the steps correctly. Likewise, you don’t want someone to wonder if they didn’t get a full grasp of the experimental results because a plot went unmentioned. This can lead to frustration and confusion.
Captions
Another way to aid visual understanding in your documentation writing is to use captions. Captions should be descriptive and short. Any content that exceeds a couple of sentences should be incorporated into the paragraph section of the document. An example of an effective caption may be something like: “The lever to open the vehicle hood is circled in blue, above.” The instructions on how to move the lever would be in the text that comes before or after the image. Be forewarned – not everyone reads captions, and they can be distracting if overused (just as footnotes are often skipped in favor of reading ahead)!
Final Thoughts
Just like a dictionary or a thesaurus, balancing visuals and text in technical documentation is an important part of any effective technical writer’s job. A picture is worth a thousand words – and graphics often enhance a document’s clarity, readability, and effectiveness.
By taking the time to:
- identify when a visual should be used,
- consider how the visual is labeled and colored,
- ask others how they interpret the visual, and
- ensure it is related to the text and context of the document,
you can rest assured that your visuals will enhance your documentation.
This article was originally published in March 2021. Updated February 2024.
Get the Paligo Pulse once a month.
Stay ahead in structured content